 Oregon Seismic Hazard Database (OSHD), release 1.0 (OSHD-1), by Ian P. Madin, Jon J. Franczyk, John M. Bauer, and Carlie J.M. Azzopardi
[Go back] | Publications Center | DOGAMI Home
Oregon Seismic Hazard Database (OSHD), release 1.0 (OSHD-1), by Ian P. Madin, Jon J. Franczyk, John M. Bauer, and Carlie J.M. Azzopardi
WHAT’S IN THIS PUBLICATION?
The Oregon Seismic Hazard Database, release 1 (OSHD-1.0), is the first comprehensive collection of seismic hazard data for Oregon. This publication consists of a geodatabase containing coseismic geohazard maps and quantitative ground shaking and ground deformation maps; a report describing the methods used to prepare the geodatabase, and map plates showing 1) the highest level of shaking (peak ground velocity) expected to occur with a 2% chance in the next 50 years, equivalent to the most severe shaking likely to occur once in 2,475 years; 2) median shaking levels expected from a suite of 30 magnitude 9 Cascadia subduction zone earthquake simulations; and 3) the probability of experiencing shaking of Modified Mercalli Intensity VII, which is the nominal threshold for structural damage to buildings. The perceived shaking and damage potential maps and the probability of damaging shaking maps are intended to provide non-specialists with a qualitative way to assess earthquake hazards, and to see the variation of hazard across the state.
PUBLICATION DOWNLOADS
report only (48 p., 7.3 MB PDF)
map plates only bundle (40 MB .zip file; see below for individual plate PDFs)
metadata only bundle (437.zip file: Esri® v10.7 format geodatabase with embedded metadata; external metadata in .xml and html formats)
GIS-only bundle (9.34 GB .zip file: geodatabase with embedded metadata; external metadata)
complete publication bundle (9.38 GB .zip file: geodatabase with embedded metadata; external metadata, 48 p. PDF report; three PDF map plates)
EXECUTIVE SUMMARY
This report describes the methods used to prepare the Oregon Seismic Hazard Database, release 1.0 (OSHD-1.0). OSHD-1.0 is the first comprehensive collection of seismic hazard data for Oregon and contains:
These data are provided in Geographic Information Systems (GIS) format; see the appendix for a list of layers included.
OSHD-1.0 is an update and extension of similar data published by Madin and Burns (2013) to support the 2013 Oregon Resilience Plan prepared by the Oregon Seismic Safety Policy Advisory Commission (OSSPAC, 2013).
The coseismic geohazard layers are updated with many areas of new surficial geology mapping that have been done using high-resolution lidar topographic data, providing greatly improved accuracy and confidence in defining areas with different coseismic geohazard conditions.
The Madin and Burns (2013) report was based on a single simulation of an Mw 9.0 Cascadia Subduction Zone earthquake, which does not significantly affect eastern Oregon. OSHD-1.0 adds the shaking maps and derivative products based on the USGS probabilistic model, which provide consistent hazard information across the entire state. In addition, OSHD-1.0 uses an ensemble of 30 Mw 9 Cascadia subduction earthquake simulations recently published by the USGS (Wirth and others, 2021), which better represents the possible variability of shaking.
The liquefaction and landslide probability and ground deformation maps were calculated using the Hazus-MH loss estimation software developed by FEMA (2011). These layers were calculated in GIS for the Madin and Burns (2013) report.
The map showing the probability of experiencing damaging shaking is a new addition, based on similar maps recently produced by the USGS (Rukstales and Petersen, 2019), and is intended to help readers understand earthquake risk at their location of interest.
The new Cascadia shaking maps differ significantly from their counterparts in the Madin and Burns (2013) report, generally with higher values. This is partly due to changes in the coseismic geohazard maps, but mostly due to differences in the simulation algorithms and earthquake source parameters.
The probabilistic shaking maps have much higher values than the Cascadia ensemble maps, partly because the Cascadia maps show the median values for the 30 simulations, while the probabilistic map nominally shows the 98th percentile value for the Cascadia earthquakes it includes. The probabilistic map also includes many earthquake sources besides Cascadia and shows shaking that has a return period of 2,475 years.
The new earthquake induced landslide ground deformation map for Cascadia events has significantly lower values at the high end of the range than its counterpart in the Madin and Burns (2013) report, due to differences in the methods of calculation.
The Cascadia ensemble data can be used directly as input to Hazus-MH to run loss estimates. They can also be used for scenario-based planning for emergency response.
The probabilistic data are better suited for engineering uses like evaluating lifeline vulnerability. They can also be used cautiously for loss estimates, with the understanding that they do not represent a single simultaneous statewide event.
The perceived shaking and damage potential maps and the probability of damaging shaking maps are intended to provide non-specialists with a qualitative way to assess earthquake hazards, and to see the variation of hazard across the state.Disclaimer
This product is for informational purposes and may not have been prepared for or be suitable for legal, engineering, or surveying purposes. Users of this information should review or consult the primary
data and information sources to ascertain the usability of the information. This publication cannot
substitute for site-specific investigations by qualified practitioners. Site-specific data may
give results that differ from the results shown in the publication.
GEOGRAPHIC INFORMATION SYSTEM (GIS) DATA
Geodatabase is Esri® version 10.7 format.
Metadata is embedded in the geodatabase and is also provided as separate .xml files. (metadata bundle)
OSHD Release 1_0.gdb contains the following:
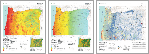
MAP PLATES
Plate 1, Perceived Shaking and Damage Potential, Probabilistic Earthquake Model - Highest level of shaking and damage expected with a 2% chance of occurring in the next 50 years from all earthquake sources (36 x 42 inches; scale 1:825,000, 15.8 MB PDF)

Plate 2, Perceived Shaking and Damage Potential, Cascadia Subduction Earthquake Model - Median shaking levels for an ensemble of 30 magnitude (Mw) 9 Cascadia Subduction zone earthquakes (36 x 42 inches; scale 1:825,000, 12.3 MB PDF)

Plate 3, Probability of Damaging Shaking - Probability over the next 50 years of experiencing shaking strong enough to damage weak buildings (36 x 37 inches; scale 1:825,000, 13.2 MB PDF)
